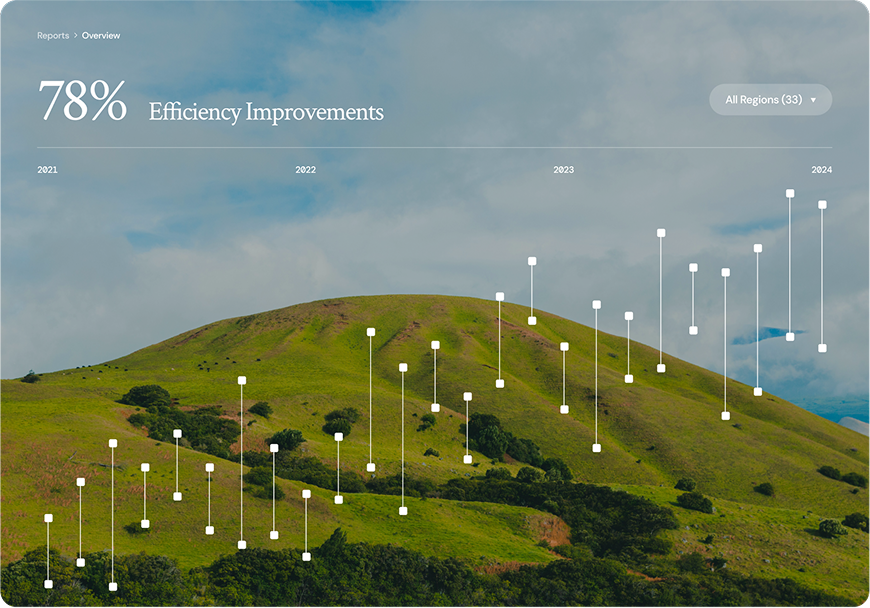







See the Big Picture
Area turns your data into clear, vibrant visuals that show you exactly what's happening in each region.
- 01Spot Trends in Seconds: No more digging through numbers.
- 02Compare Regions Easily: See what changes fast and where.
- 03Find Key Insights Fast: Turn raw data into clear actions.
- 04Share Reports Instantly: Keep every team aligned around one clear view.

Why Choose Area?
You need a solution that keeps up. That's why we developed Area. A developer-friendly approach to streamline your business.
Discover More- Area
- Real-time dashboards
- Advanced AI insights
- Seamless integrations
- No-code report builder
- Enterprise-grade speed
- Full UTF-8 support
- WebSurge
- Fast dashboards
- Basic AI recommendations
- Limited integrations
- Basic AI insights
- Average refresh rates
- Potential display errors
- DataVista
- Moderate refresh rates
- Export-heavy workflows
- Steep learning curve
- No AI assistance
- Delayed refreshes
- Partial UTF-8 support

"I was skeptical, but Area has completely transformed the way I manage my business. The data visualizations are so clear and intuitive, and the platform is so easy to use. I can't imagine running my company without it."
Map Your Success
Discover More01
With our intuitive setup, you're up and running in minutes.
02
Adapt Area to your specific requirements and preferences.
03
Make informed decisions to exceed your goals.

Connect with us
Schedule a quick call to learn how Area can turn your regional data into a powerful advantage.
Book a Demo